Sprint Progress Tracker: Measure and Improve Your Speed
Use a sprint progress tracker to record times, monitor fatigue, identify trends, and make smarter training decisions that improve sprint performance.


Use a sprint progress tracker to record times, monitor fatigue, identify trends, and make smarter training decisions that improve sprint performance.
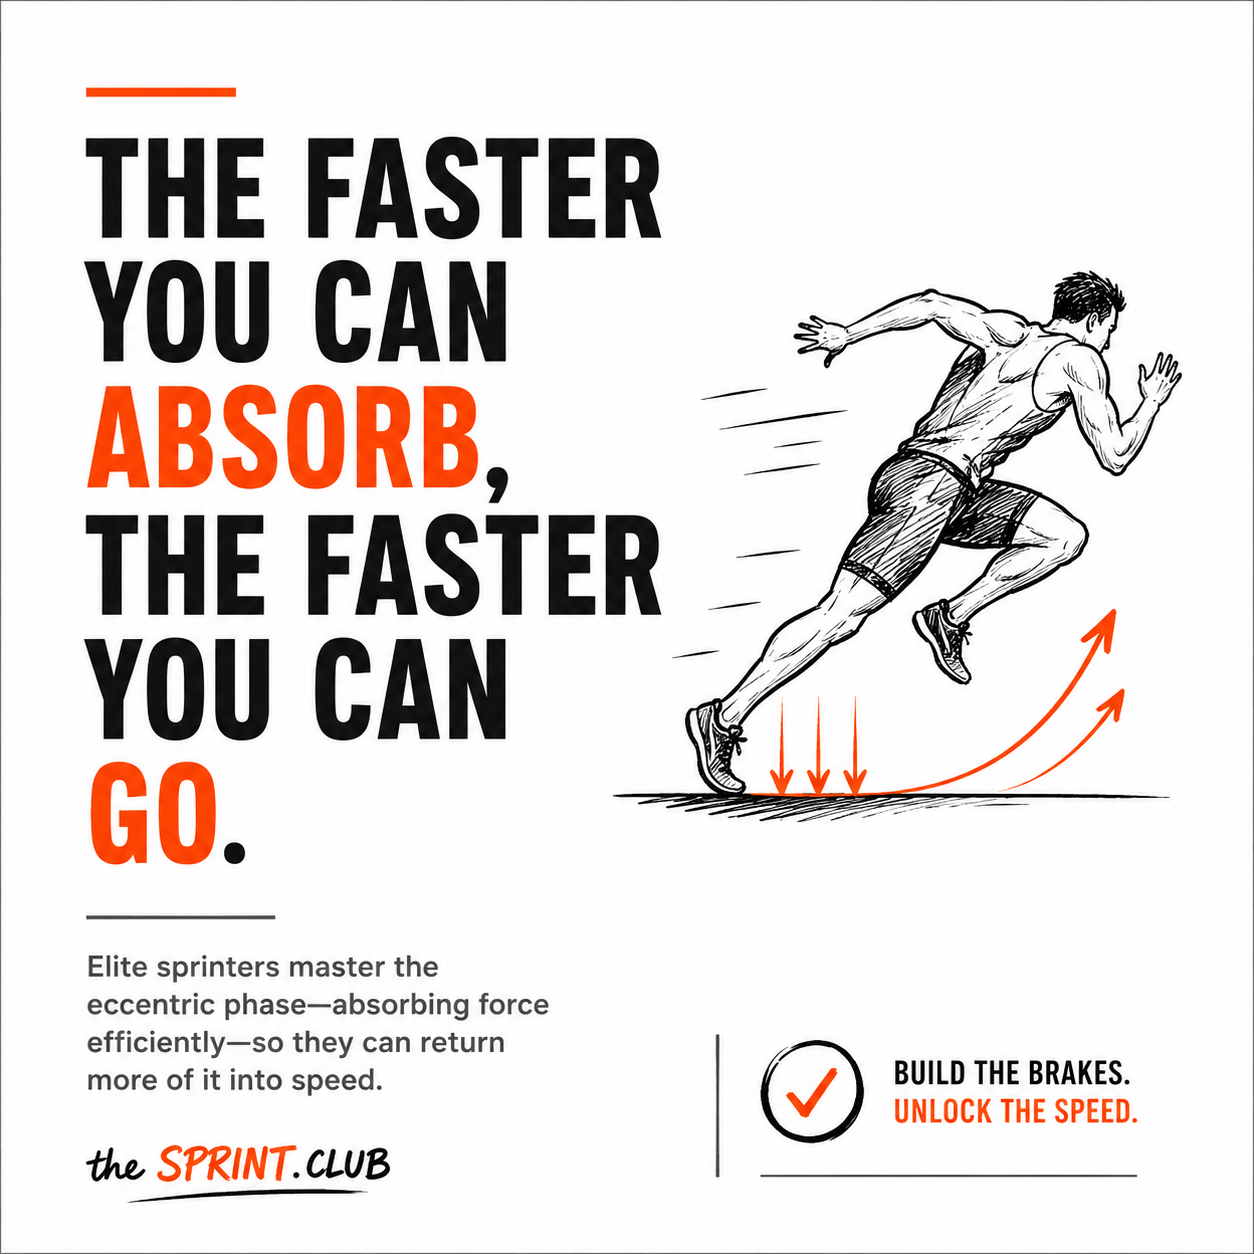
Most athletes focus on producing force. Elite sprinters also master absorbing it. Every sprint step begins with a collision between
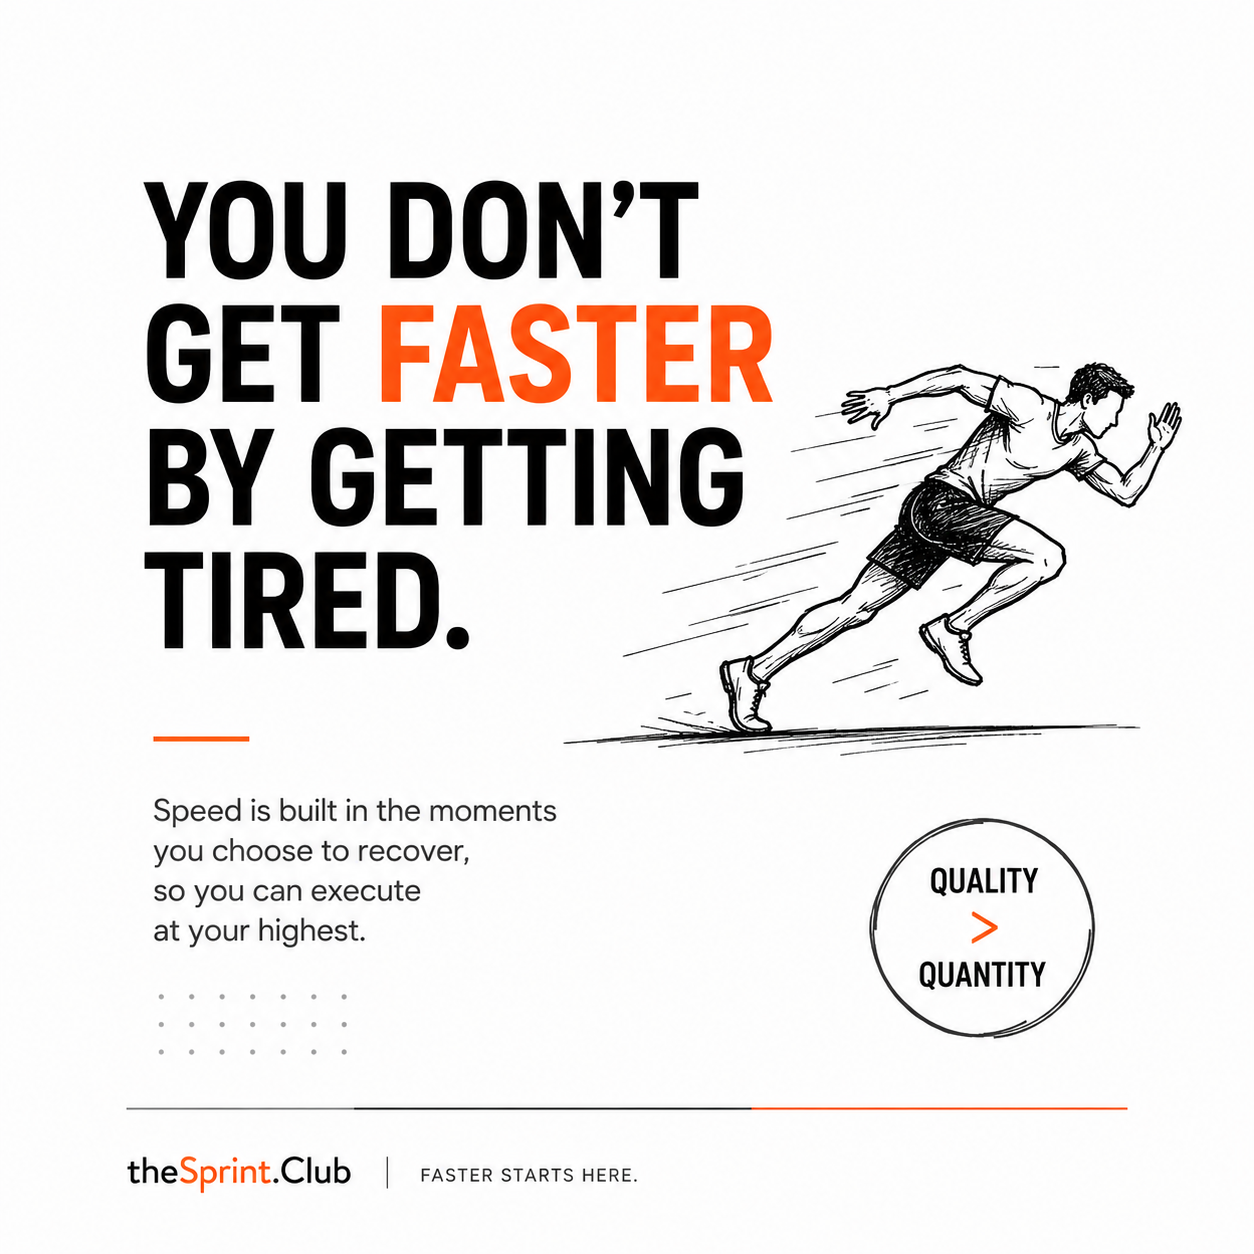
Working harder doesn’t always make you faster. In sprinting, excessive training volume can quietly reduce speed by increasing fatigue, disrupting recovery, and degrading mechanics. This “Volume Trap” causes longer ground contact times, lower force production, and slower sprint performances, even when athletes are putting in maximum effort. Learn why quality beats quantity, how overtraining affects the nervous system, and the practical strategies elite coaches use to keep athletes fresh, explosive, and consistently improving. Discover how objective testing, the sprint drop-off method, and smarter recovery practices can help you build speed without burning out.