How to Get Faster: The Missing Link in Max Sprint Speed
Most athletes never truly train max velocity. Learn how to get faster by improving top-end sprint speed with science-backed methods.


Most athletes never truly train max velocity. Learn how to get faster by improving top-end sprint speed with science-backed methods.
Learn how to get faster with proven acceleration training methods. Improve first-step quickness, horizontal force, and sprint mechanics.
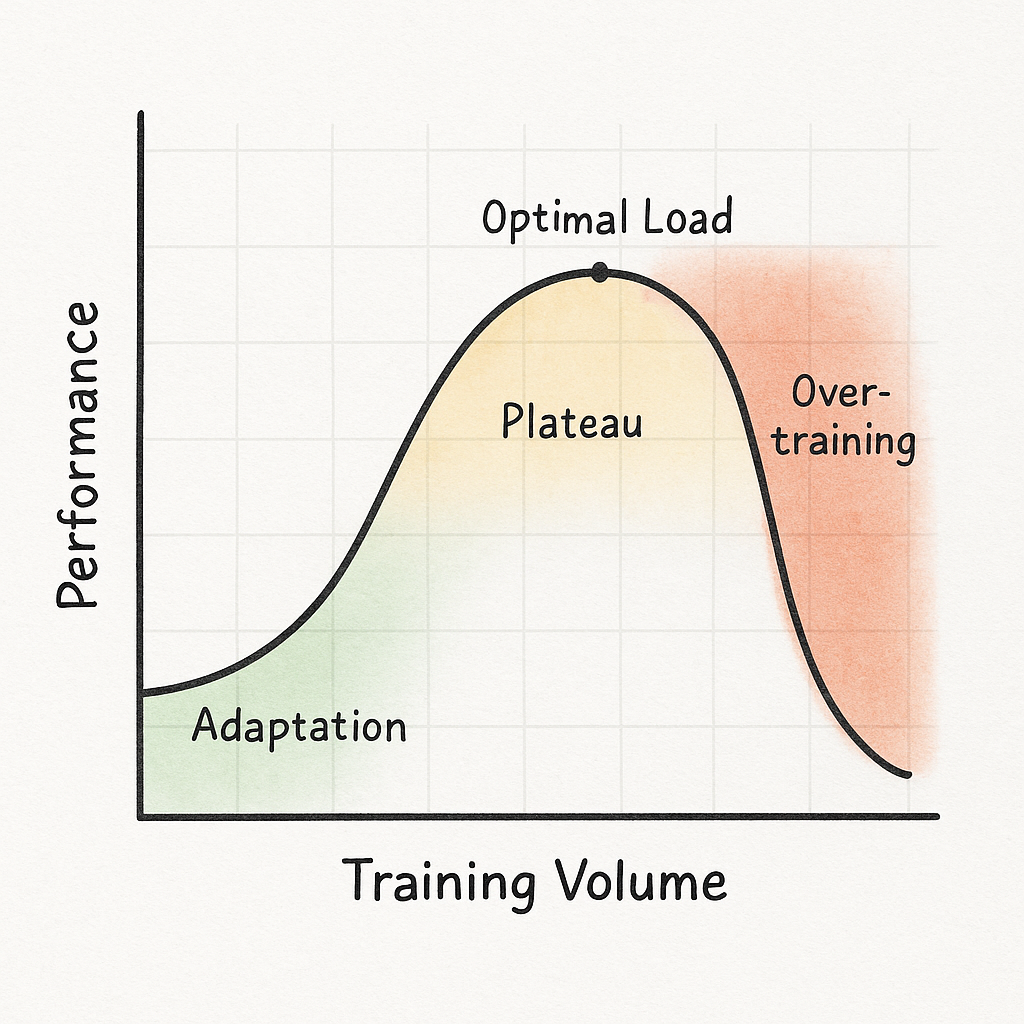
The Speed Plateau Series: How to Break Through and Get Faster
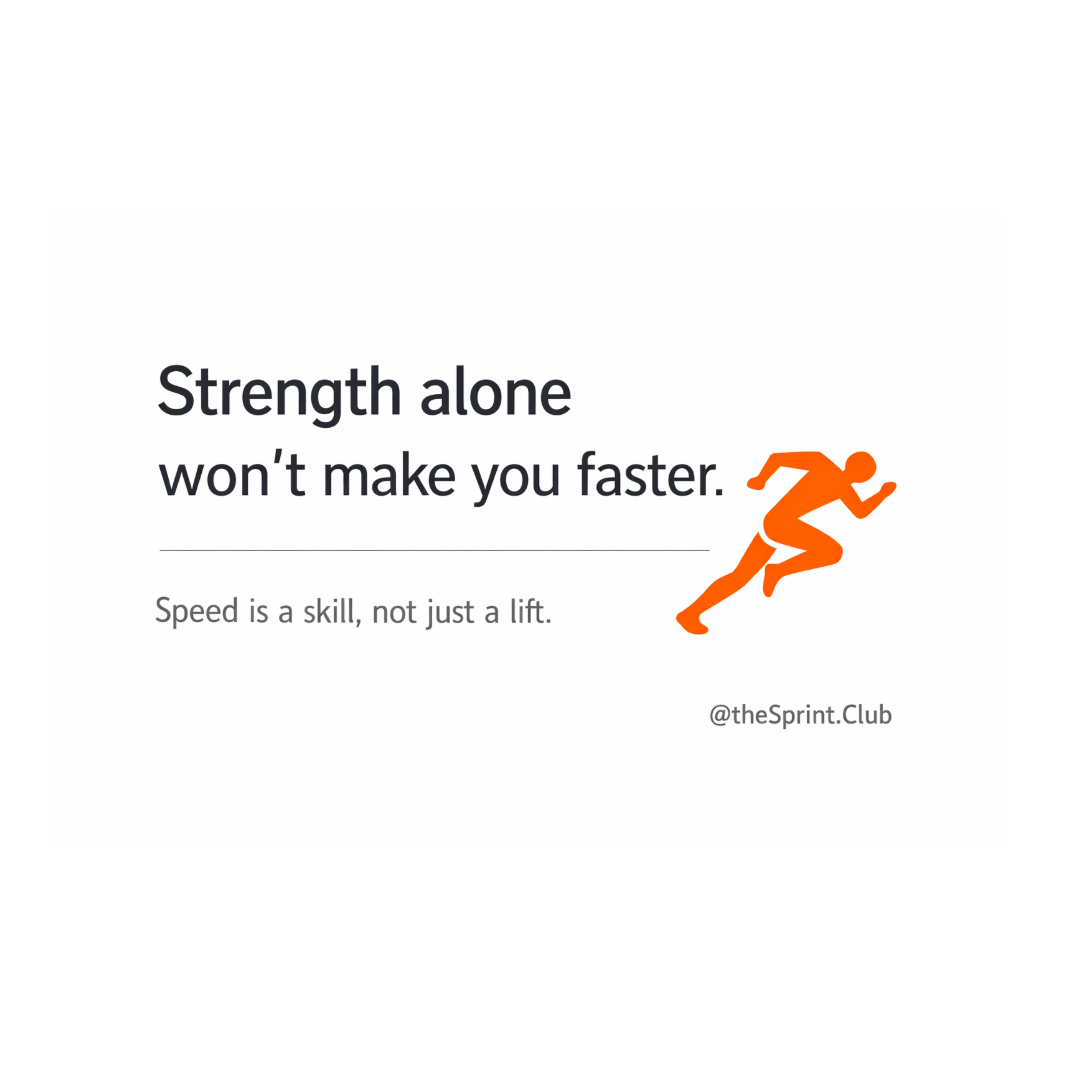
You can get stronger for months and still stay the same speed. Squat up, deadlift up, vertical up, but the 40 does not move. That plateau is common in sprint based sports because sprinting is not a test of how much force you can produce. Sprinting is a test of how much force you can apply in extremely short ground contact times, in the right direction, without leaking it through mechanics or fatigue.