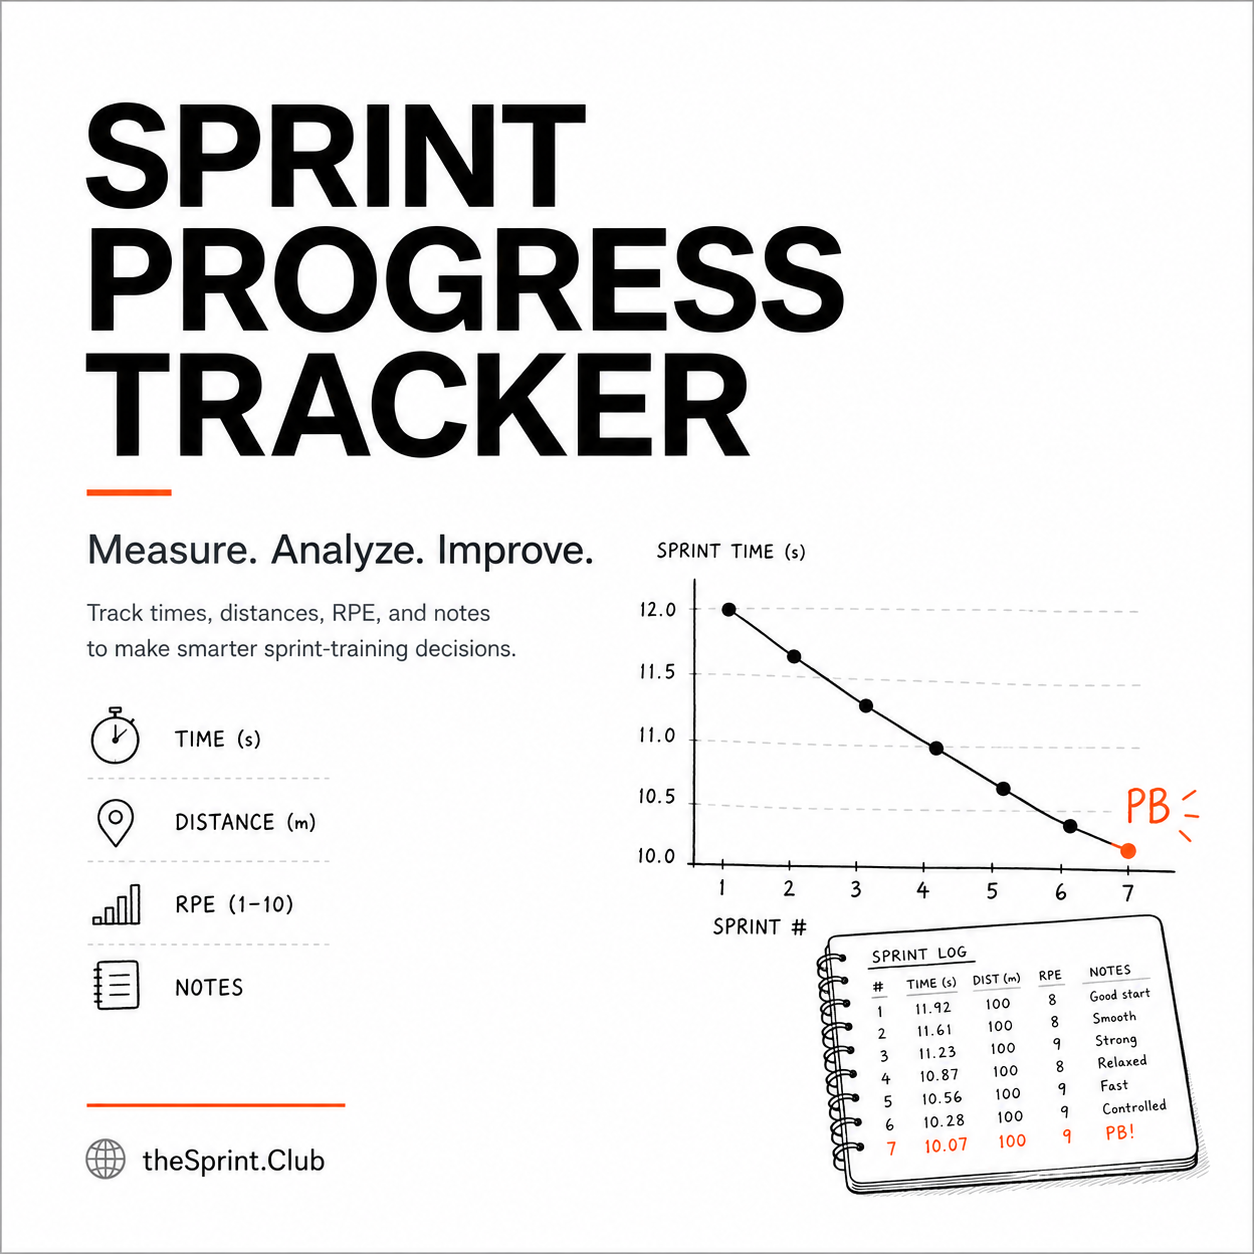
Sprint Progress Tracker: Measure and Improve Your Speed
Use a sprint progress tracker to record times, monitor fatigue, identify trends, and make smarter training decisions that improve sprint performance.


There is a quiet assumption baked into sprinting: run fast in high school, and the future will take care of itself.
The data tells a very different story.
Between promise and performance lies a fracture point, a place where careers accelerate or quietly disappear. The jump from high school tracks to collegiate competition is not just a step up in speed. It is a filtration system. And most do not pass through it cleanly.
This is not about talent. It never was. It is about what survives the transition.
The move from high school competition into collegiate sprinting is not linear it is disruptive.
For athletes classified as “Elite Tier”, those running ≤10.50 (men) or ≤11.50 (women) in the 100m, expectations look simple on the surface: progress, improve, get faster. But beneath that expectation sits a biological and structural reality that nobody warns you about. High-performance speed does not scale cleanly.
This analysis tracks 1,096 elite sprinters (684 men, 412 women) from graduation classes 2015–2022, using verified databases including TFRRS, MileSplit, Athletic.net, and World Athletics.
The question driving it is deceptively simple: What actually happens after high school speed peaks?
Each year, more athletes cross the elite threshold. More depth. Faster times. Higher ceilings.
The class of 2022 did not just match previous years, it exceeded them. Male sprinters like T’Mars McCallum (10.13) and Pierre Goree (10.22) posted marks that would have dominated earlier eras. On the women’s side, athletes like Shawnti Jackson (10.89) and Briana Williams (10.94) compressed what “elite” even means.
But here is the problem: more talent entering does not mean more talent progressing.
Strip away the noise, and the numbers settle into something uncomfortable:
Nearly 4 out of 10 elite athletes never get faster again. That is the first fracture.
And it gets more interesting.
Female sprinters outperform males in progression rates — and the gap is not trivial.
A difference of ~5.7%. This is not random.
Female athletes often enter college with more developmental runway, while many male sprinters arrive already closer to their physiological ceiling. Years of early power development compress their future margin.
The translation is uncomfortable but important: some athletes peak earlier than they realize.
Improvement is not evenly distributed, it shrinks as performance increases.
Athletes entering at 10.45–10.50 tend to improve more than those entering near 10.00. The closer you get to the barrier, the more expensive each hundredth of a second becomes.
Consider Matthew Boling:
That looks impressive, and it is. But it is still smaller than the −0.25 improvements often seen in slightly slower entrants.
Speed has diminishing returns. Not because effort decreases, but because constraints increase
Not all programs are equal. Some consistently convert talent into progression.
When isolating the top 10% of improvers, specific programs emerge again and again:
Indiana
North Carolina A&T
UC Irvine
Minnesota
Georgia
Florida
Tennessee
LSU
Virginia
Houston
These programs do not just recruit fast athletes. They produce faster ones. The question is why and the answer breaks into three forces.
Programs with dedicated sprint coaches outperform generalized systems, consistently.
Coaches like Duane Ross and Mike Holloway are not just training athletes. They are managing velocity, mechanics, and adaptation windows with surgical precision. This is not generic strength training. It is targeted speed development.
SEC and Big Ten programs dominate. Not by accident.
When every training session includes elite-level athletes, the nervous system adapts differently. The environment itself becomes a stimulus. 70% of top-performing programs sit inside these two conferences. Speed clusters matter.
Successful athletes consistently reach ≥2.0x bodyweight squat ratio. This is not about strength for its own sake, it directly impacts the mechanics of speed:
Speed is not just about how fast you move. It is about how fast you can apply force and get off the ground.
The nearly 39% drop-off rate is not random. It follows patterns and they are predictable.
Only 17% of male U18 top-50 athletes and 21% of female U18 top-50 athletes remain top-50 as adults. High school dominance is a weak predictor of what comes next.
About 22% of elite male sprinters are dual-sport athletes, and football changes everything: body composition shifts, energy system demands conflict, training priorities diverge. The result is almost always plateau or regression.
The jump to college is not gradual, it is abrupt.
athlete, school, hs_pb, college_pb.
Times in seconds (e.g., 10.32).
athlete, you can still include it, it’s only used for the table.| School | Athletes | Avg Δ |
|---|---|---|
| — | ||
| Athlete | School | HS PB | College PB | Δ | Bucket |
|---|---|---|---|---|---|
| — | |||||
This entire dataset converges on one idea: genetics gets you in. Everything else determines what happens next.
The programs that win are not just stronger — they are more precise. They manage load, recovery, technical progression, and force development as an integrated system. They understand that speed is fragile, and that progression is never guaranteed.
The myth is simple: fast young athletes become fast adults.
The data disagrees.
It is environment. Structure. Timing. Load. Coaching.
The transition from high school to college is not a continuation. It is a filter. And most never realize they were being tested — until it is already over.
Use a sprint progress tracker to record times, monitor fatigue, identify trends, and make smarter training decisions that improve sprint performance.

Most athletes focus on producing force. Elite sprinters also master absorbing it. Every sprint step begins with a collision between

Working harder doesn’t always make you faster. In sprinting, excessive training volume can quietly reduce speed by increasing fatigue, disrupting recovery, and degrading mechanics. This “Volume Trap” causes longer ground contact times, lower force production, and slower sprint performances, even when athletes are putting in maximum effort. Learn why quality beats quantity, how overtraining affects the nervous system, and the practical strategies elite coaches use to keep athletes fresh, explosive, and consistently improving. Discover how objective testing, the sprint drop-off method, and smarter recovery practices can help you build speed without burning out.

Train with confidence. Know exactly what to work on and why it matters
Access free tools & calculators built to help coaches and athletes train smarter.