|
|
|
|
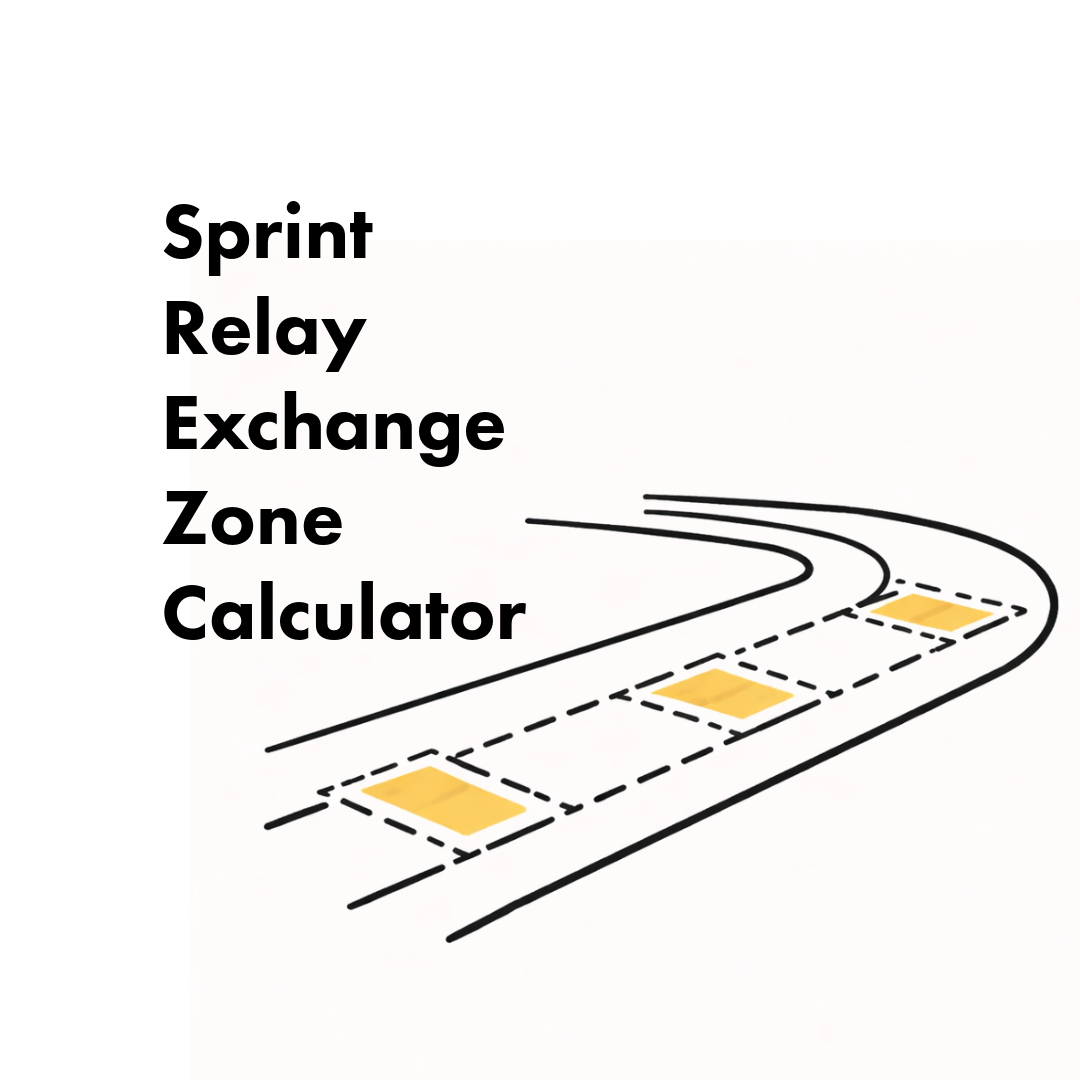
Most relay exchanges do not fall apart because athletes are slow, they fall apart because the team is guessing. The Sprint Relay Exchange Zone Calculator turns the exchange from a vague feel into a repeatable setup by giving you a practical go mark and a target handoff point, based on the speeds that actually matter inside the 30 m zone. Instead of hoping the baton arrives “somewhere late,” you can model the outgoing build, account for reaction time, flag risky speed mismatches, then calibrate with a few reps and small 0.25 to 0.50 m adjustments. The result is fewer panic reaches, fewer emergency brakes, and a handoff window that you can reproduce under pressure.
|
|
|
The core problem this calculator solves
|
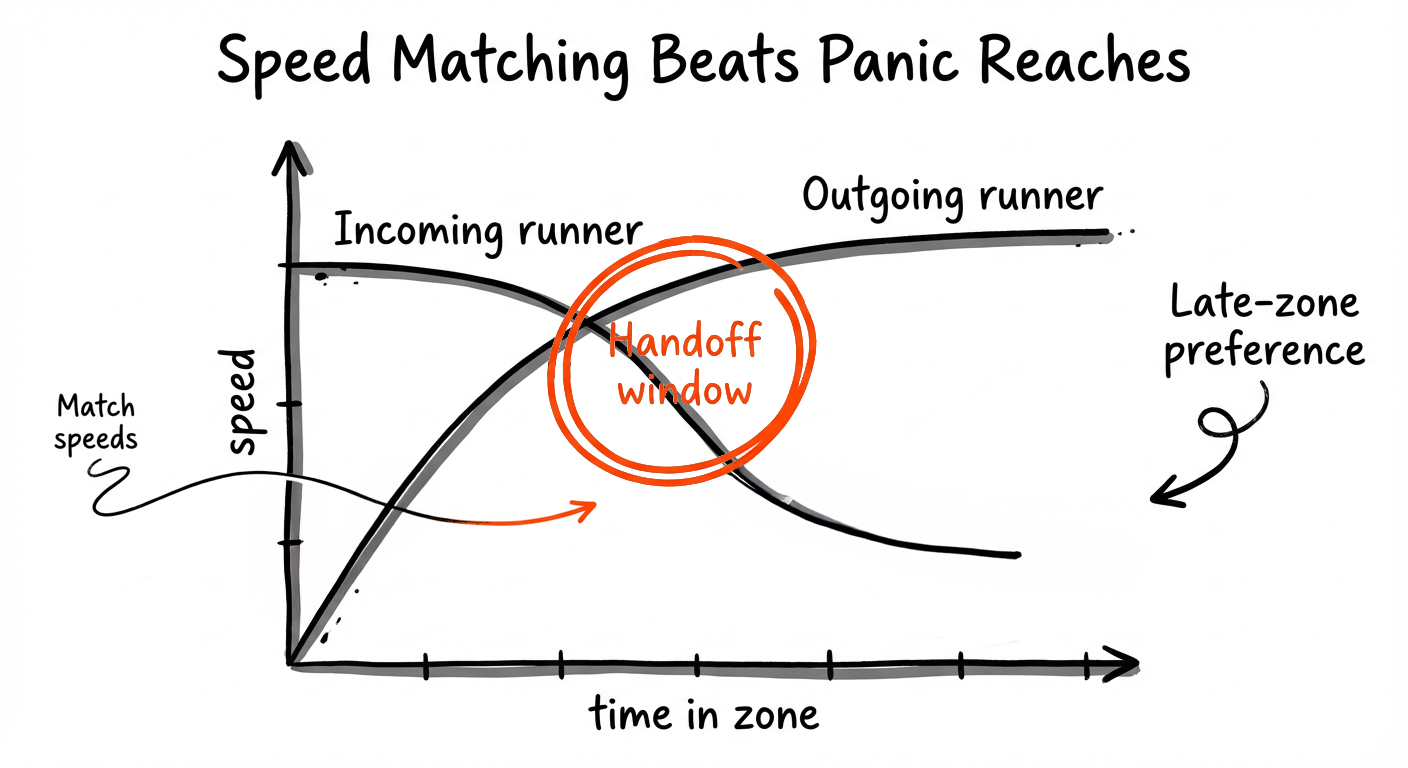
A fast relay exchange is usually not about a heroic reach.
|
|
It is about getting the outgoing runner to a usable speed early enough, so the baton can move through the exchange zone with minimal braking and minimal panic.
|
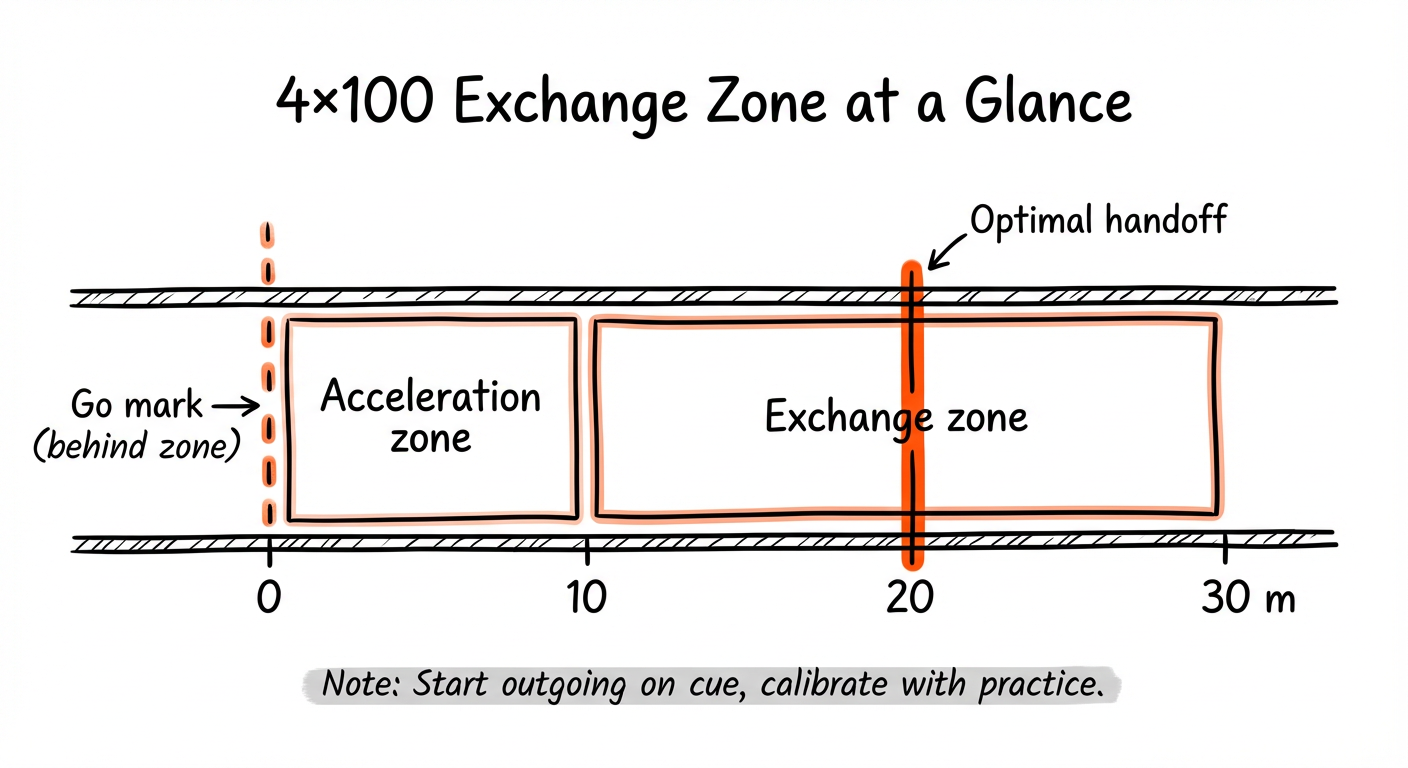
This calculator is built around the standard 30 m available distance:
|
- 0 to 10 m: acceleration zone
- 10 to 30 m: exchange zone
- Recommended go mark, measured behind the start of the acceleration zone.
- Target handoff point, measured into the 20 m exchange zone.
- Predicted speeds at handoff and the velocity differential (mismatch).
|
|
|
How to use the calculator in practice (fast workflow)
Step 1: Pick a handoff philosophy first
|
- If you prefer late, safe handoffs, choose the late-zone options.
- If you want middle-late handoffs, pick that option, then accept that the outgoing runner needs to be ready earlier.
Step 2: Enter inputs that you can defend
|
- Incoming runner entry speed should be based on what happens in real relay reps, not open 100 m peak speed.
- Outgoing runner time to 80 percent max matters more than “max speed potential” for most teams, because the outgoing runner is still building.
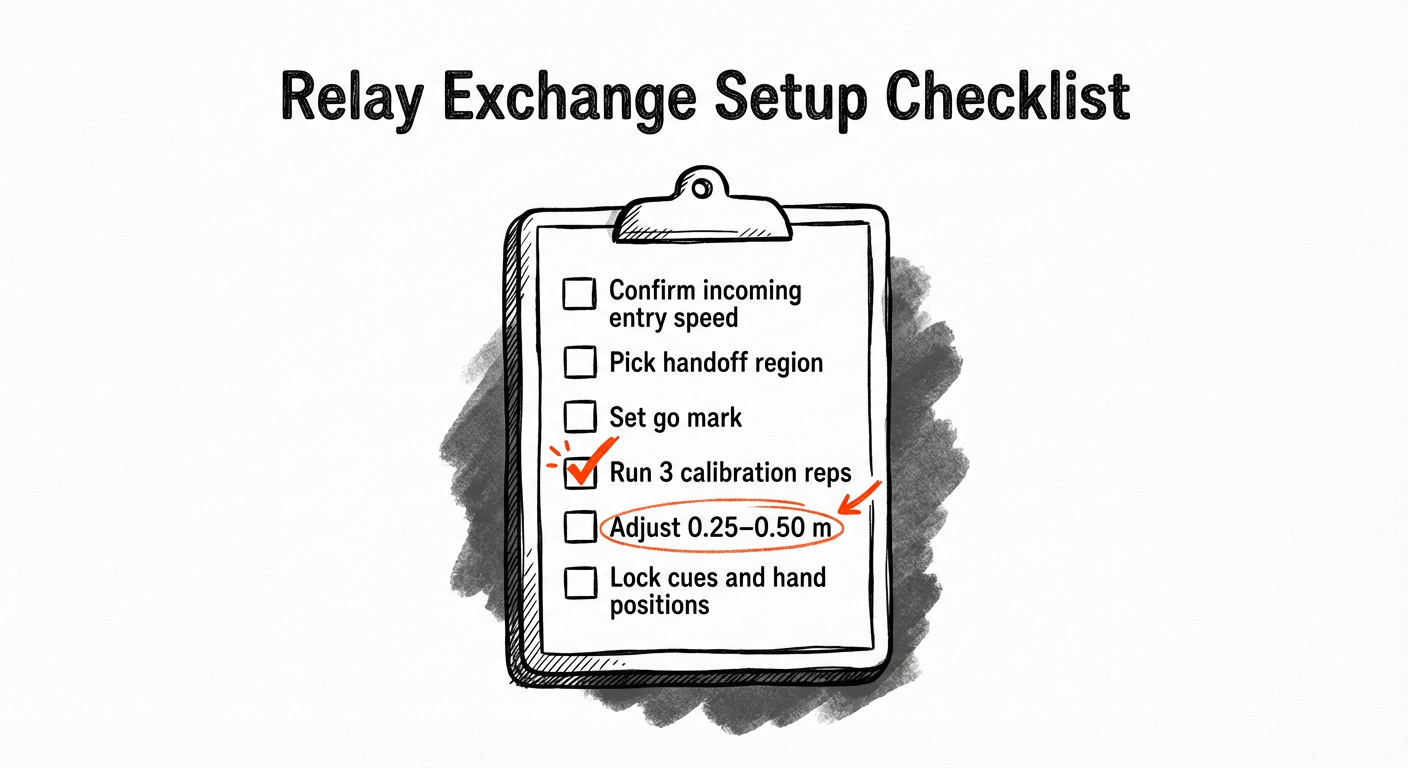
Step 3: Treat the output as your first draft
|
- Put the mark down.
- Run 3 to 6 reps at realistic intensity.
- Adjust the mark in small steps.
- Typical step sizes are 0.25 m to 0.50 m.
|
|
|
|
|
|
What each input actually means on the track
- Velocity at start of 30 m zone
- This is the speed at the start of the acceleration zone.
- It changes with curve running, fatigue, and how the leg is set up.
- Velocity loss across the 30 m zone
- This is a coach-controlled assumption.
- Use it to model the fact that many runners will not hold constant velocity through the full 30 m.
- Time to reach 80 percent max velocity
- A practical proxy for “how fast they can get up to speed.”
- This strongly influences how early the go cue must happen.
- Reaction time to the go cue
- A small number that can produce big differences at the mark.
- If athletes vary a lot here, your go mark will look unstable until cues get consistent.
- Combined reach buffer
- Think of this as the usable handoff window.
- Bigger is not always better if it encourages reaching, twisting, or braking.
- Velocity mismatch threshold
- Use this as a warning system.
- A large mismatch often shows up as a “catching” receiver, or a reaching passer.
High-value coaching tips that pair well with the calculator
Tip 1: Calibrate the cue before you calibrate the mark
|
- If the outgoing runner’s “go” is inconsistent, the best mark in the world will look wrong.
- Standardize:
- cue word
- when the cue happens
- where the outgoing runner is looking
- first 3 steps rhythm
Tip 2: Use late-zone targets to protect mechanics
|
- Late-zone handoffs can reduce the probability of forced reaches.
- This can help teams that struggle with:
- poor posture during handoff
- deceleration in the zone
- inconsistent arm carriage
Tip 3: Speed match first, then fine-tune hand placement
|
- If speeds are not matched, hand technique changes tend to fail under pressure.
- Use the velocity differential output as a “mechanics risk” flag.
Tip 4: Track two numbers over time
|
- Go mark (meters behind zone)
- Observed handoff location (early, middle, late)
If go mark changes every practice, the instability is usually in:
|
- the cue timing
- the outgoing runner’s first steps
- the incoming runner’s entry speed on that day
|
|
|
|
|
|
|
|
|
|
|
|
|
Thanks for reading. See you soon!
|
|
|
|
|
Sprint Progress Tracker: Measure and Improve Your Speed
|
|
|
|
Use a sprint progress tracker to record times, monitor fatigue, identify trends, and make smarter training decisions that improve sprint performance.
|
|
|
|
|
|
|
|
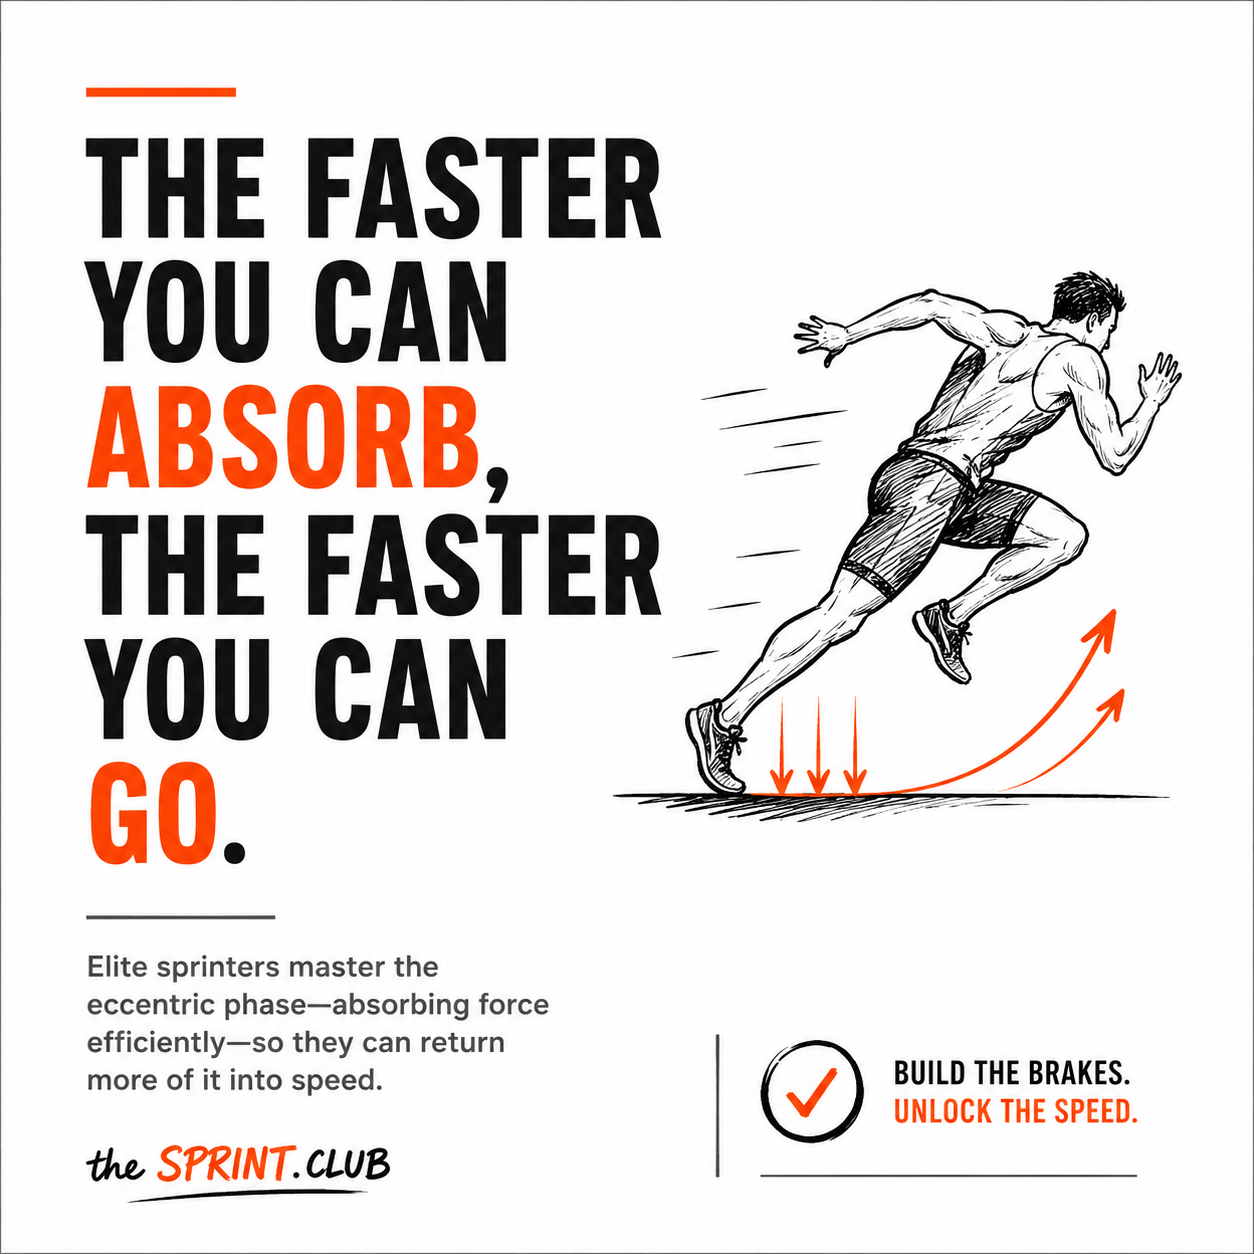
Why absorbing force efficiently is the missing link to faster sprint times, shorter ground contacts, and better performance.
|
|
|
|
Most athletes focus on producing force. Elite sprinters also master absorbing it. Every sprint step begins with a collision between the foot and the ground. Before you can produce force, your body must accept it. Athletes who develop exceptional eccentric strength can absorb larger forces, store more elastic energy, reduce ground contact time, and return more of that energy into …
|
|
|
|
|
|
|
|
|